How to Add DataModel in Motadata
Login to Motadata
Go to Admin > Data Models.
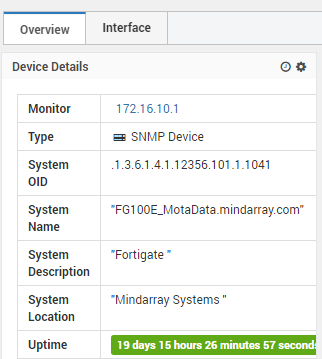
If you have discovered the SNMP Device and you do wish to add the OIDs for the same, please go to Monitor -> Device Details -> from here, you can find the main OID of the device:
Now, search the Main OID here, make sure their count value should be present like 1 or 2 as per the monitors:
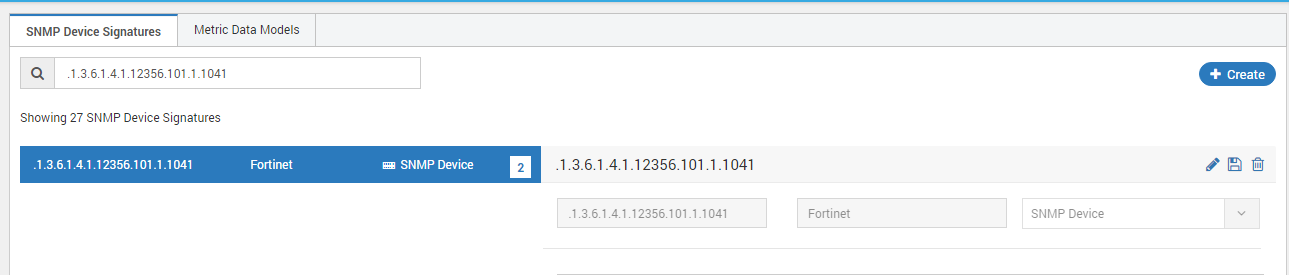
You can edit the Main OID by clicking on Edit icon or you can also create as per your requirement by clicking on Create Icon.
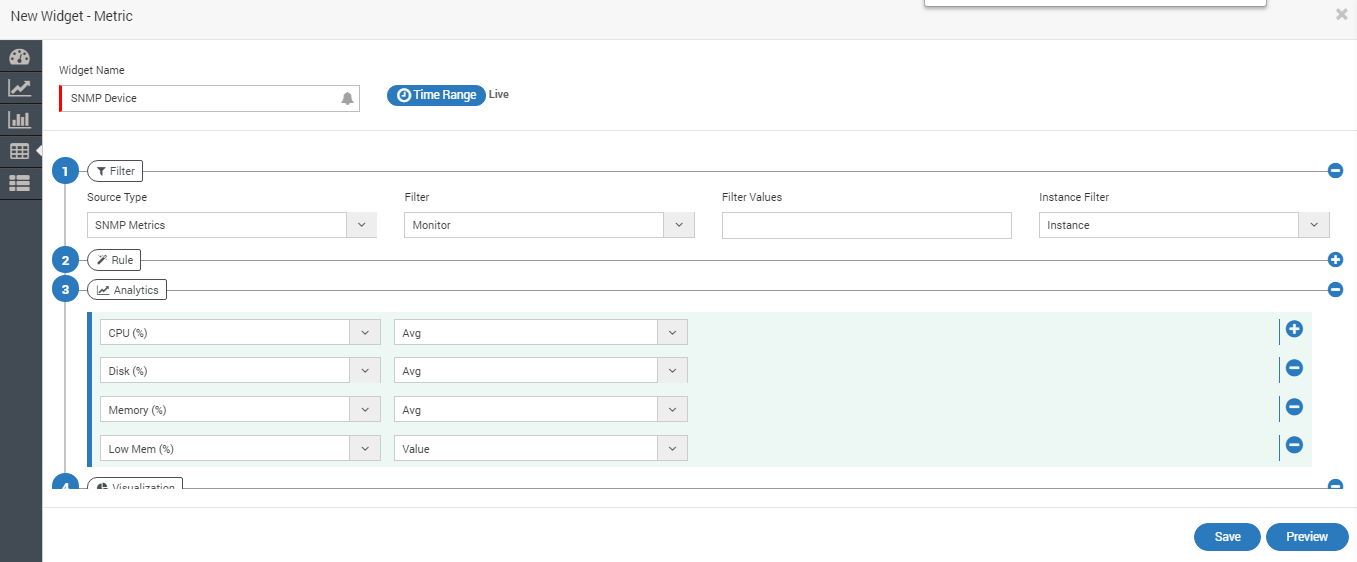
If you are editing Main OIDs and wants to add the following values, you can add as per the screenshot, make sure to select the proper Data Type like Numeric or String:
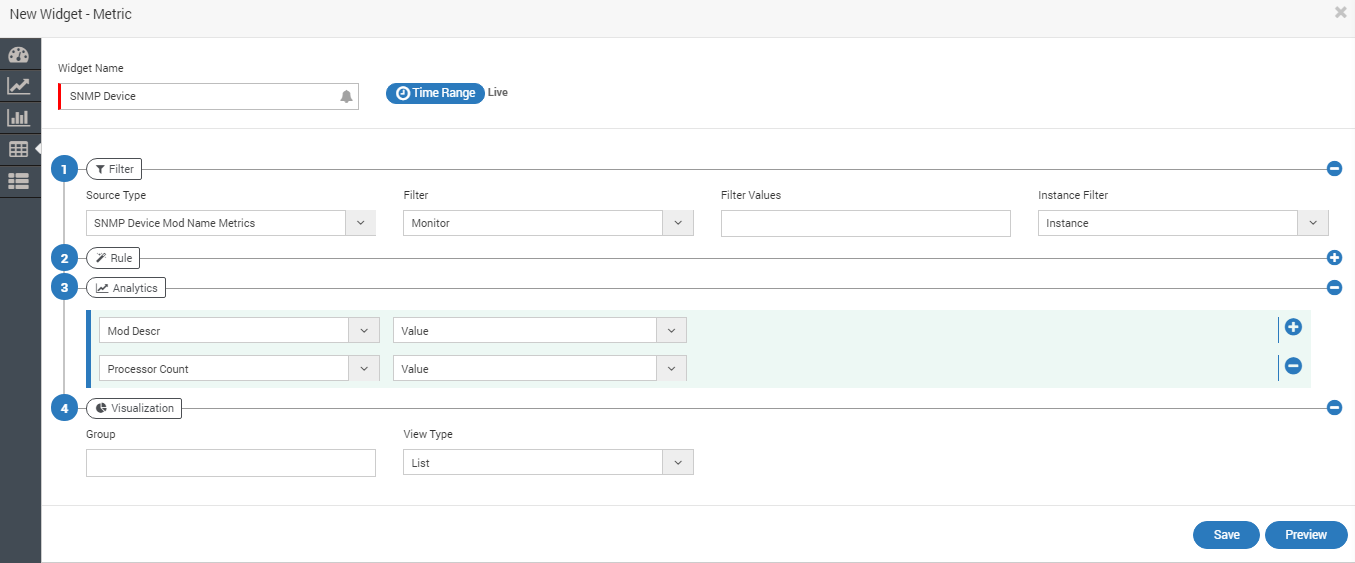
CPU Memory (%) Disk (%) Low Mem (%) Mod Name -> Mod Descr -> Processor Count
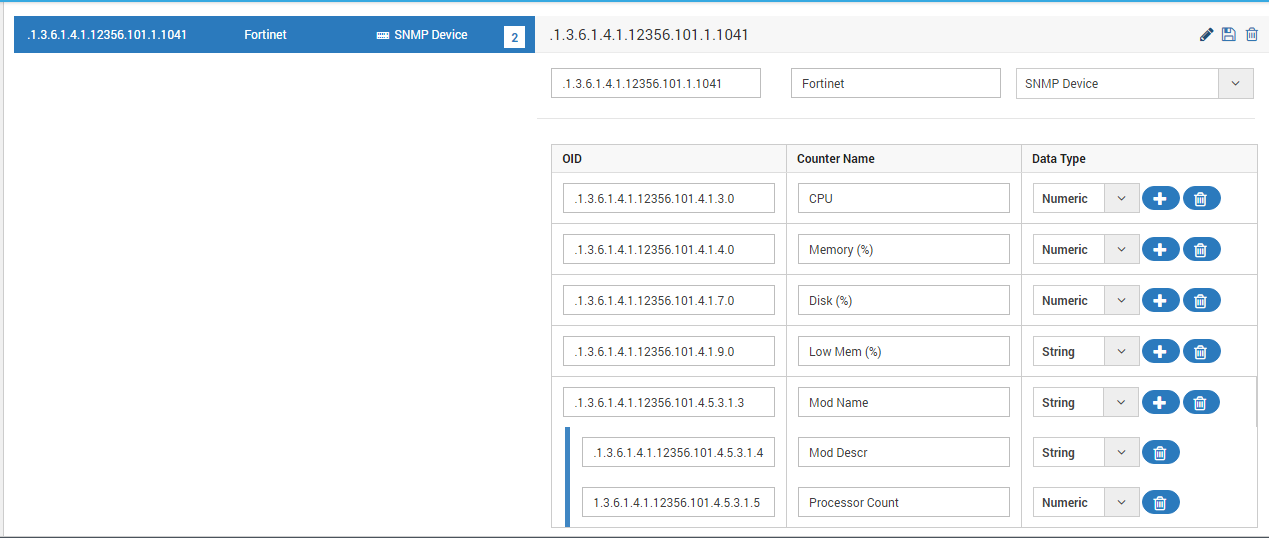
Once you are done with the above screenshot, click on Save icon to save the Data Model.
Note: The Name of Data Model Will be as per the following:
For CPU/Memory/Disk/Low Mem:
For Mod Name -> Mod Descr -> Processor Count:
Once you are done with the widget creation, wait for next pool to get data populated.
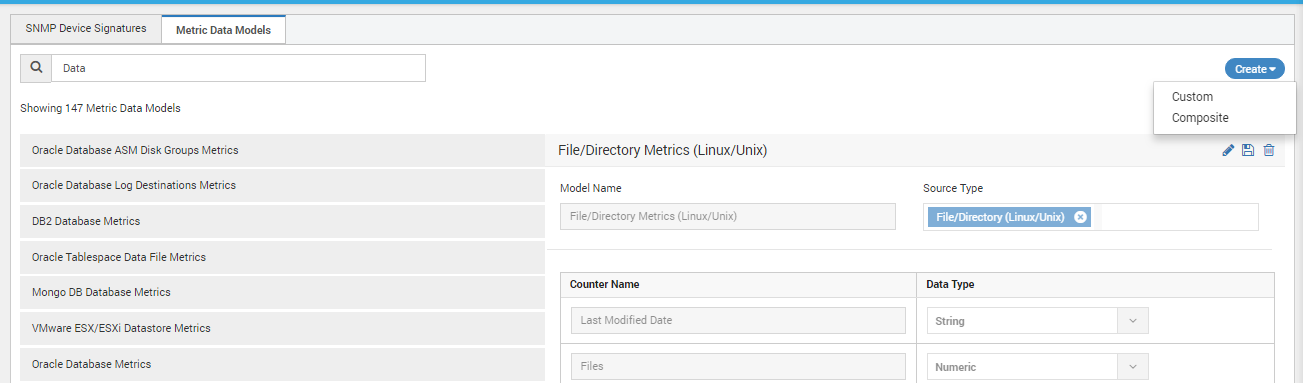
If you are using Data Query to have multiple Columns, you need to move to Metric Data Model -> From here, you will need to create Data Model by clicking on Create -> Custom:
Prepare a widget as per the following:
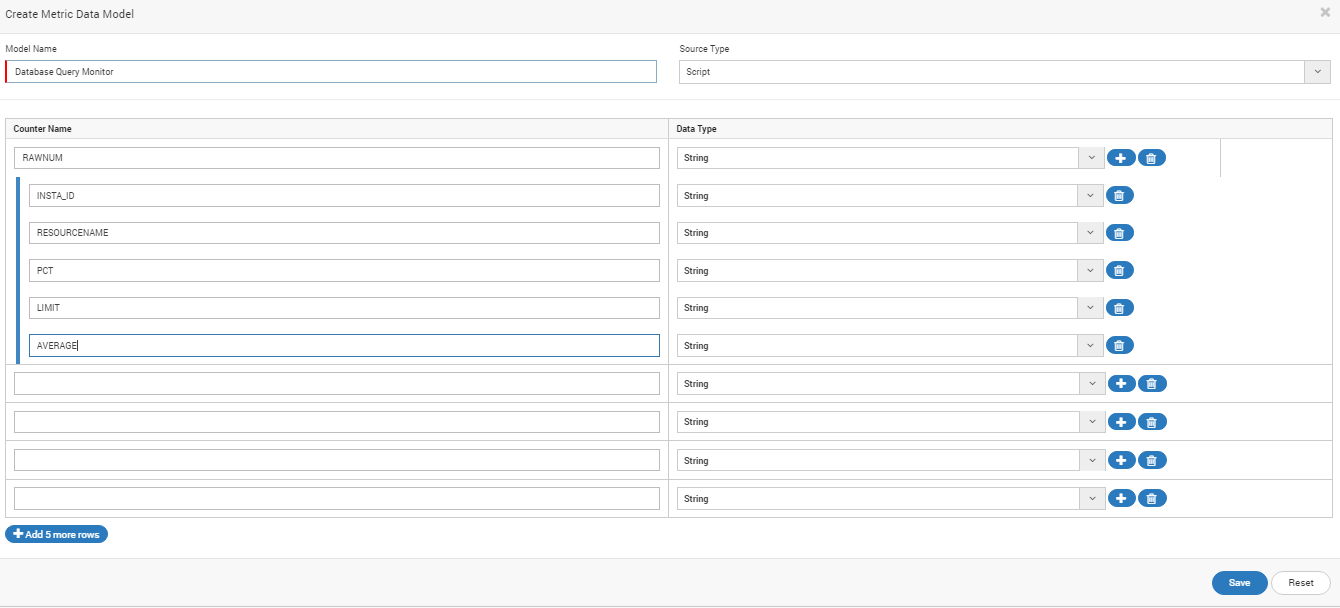
Select as per following:
Model Name -> You can define as per your requirement
Source Type -> Select Database Query instead of Script if you are preparing widget for the Database Query
Counter Name -> In counter name, there should be a number columns on which Primary key or Foreign Key is applied like if we have used RAWNUM, the value of it will be increased by 1,2,3,4,5,6,7,8,9.10 etc. so create with RAWNUM (You choose as per the query output or alias)
Once it is done, please click on Save button to save Data Model.
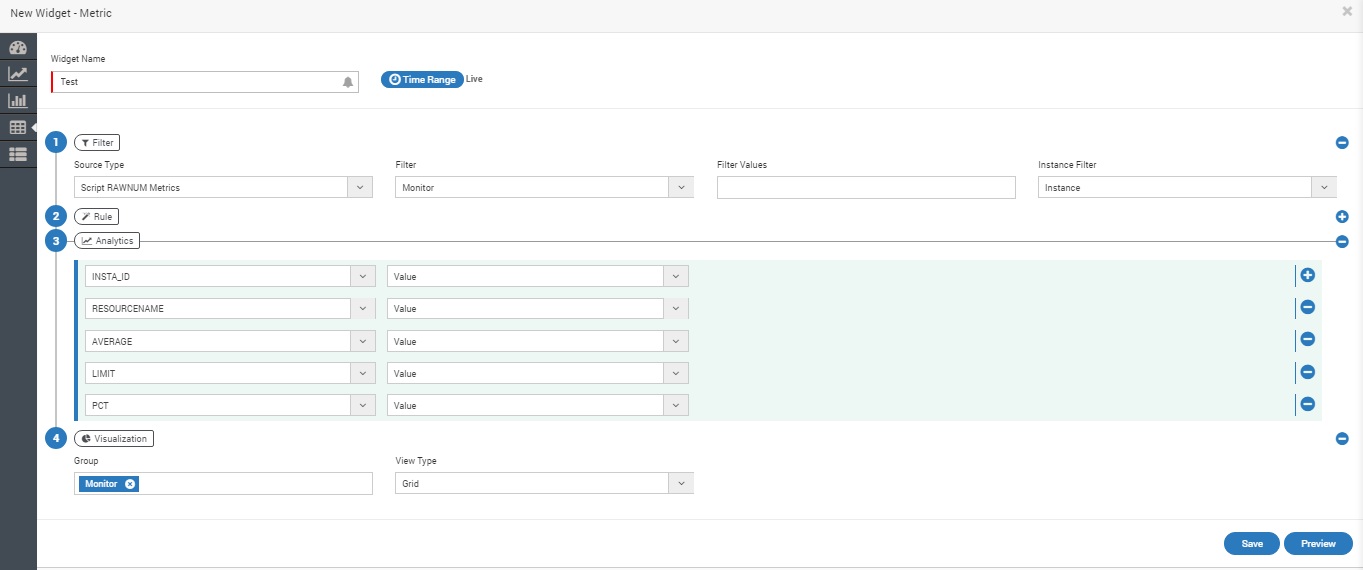
Go to Monitor Tab -> Click on Widget -> Metric, the widget will be create as per the following:
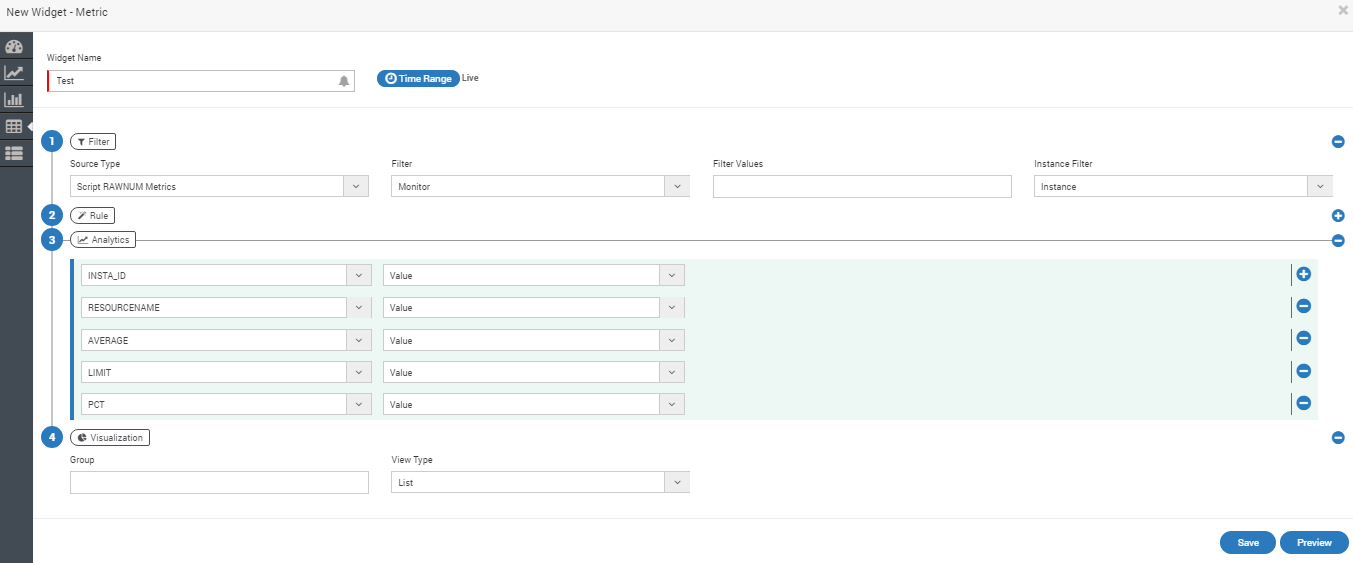
Widget Name -> This will be the Name of Widget
Time Range -> It will be as per your requirement, we have selected live
In Filter:
Source Type -> This will be Database RAWNUM Metrics if you are creating widget for Database Query Monitor
Rule: You can apply Rule as per your requirement
Analytics: From here, you can select the fields which you have provided in Data Model
In Visualization:
You can select Monitor and View Type as Grid to check in Widget Data in identical manner.